Social Engineering Attack Map

Your click rate
is not
intelligence.

S.E.A.map transforms phishing simulation data into behavioral intelligence, built on years of experience and 800+ custom-built simulations across 200+ organizations. Not a template. Not a benchmark service. A methodology.

SEA.ops · 800+ tailored simulation
Years of field data
Personalization impact on click rate
zero-context vs. fully contextualized
2.1×
more clicks
Internal sender impersonation
vs. external sender campaigns
+75%
click rate
Your click rate fell since the last campaign, real improvement or a different mechanism?
comparable by emotion in S.E.A.map
in your report
How many of your victims returned after first submission, and what that signals
PPI mapped per campaign in S.E.A.map
in your report
The asset behind the product

800+ simulations.
No library. No templates.

S.E.A.map brings real-world experience: 800+ specialized, template-free, phishing simulations executed across 200+ organizations. Market experience categorized by over 30 variables (100% anonymized) which, at scale, provide unique insights into Social Engineering. This database does not exist anywhere else.

200+
Organizations

Realistic application. Featuring simulations built from OSINT across national and global companies in 17 industry sectors. The financial sector alone accounts for 62 organizations—nearly 1 in 3. Regulated industries represent 51% of the dataset.

SEA.ops Dataset
ERI
Emotional Risk Index

Which emotional vector your last campaign exploited, how intensely, and how that compares across 17 industry sectors. The number behind the click.

⊘ Available in your S.E.A.map
CEF
Cognitive Escape Factor

How many of your victims managed to avoid 'autopilot' during the click > collect filter. Reveals the gap between security Intent vs. Behavior.

⊘ Available in your S.E.A.map
PPI
Phishing Persistance Index

How many of your victims returned after the first credential submission, and what behavioral profile that signals. Calculated per campaign, benchmarked against dataset of simulations.

⊘ Available in your S.E.A.map
→ Question 01

The emotion that drives the most clicks is not the one that drives the most credential submissions. Do you know which one your last campaign actually exploited?

→ Question 02

In most simulations, victims don't submit once, they return. Did yours? And if so, which profile of employee came back, and why?

→ Question 03

Your click rate fell since the last campaign. Did you improve, or did you just run a mechanism that converts less? Without naming the emotion behind each campaign, a number that rises or falls is noise, not signal.

The standard report falls short

A click rate is a number.
Not a diagnosis.

Knowing 23% clicked tells you nothing about why they clicked, who's exposed, or what to train. And if last quarter it was 28%, that doesn't prove improvement, it could just be a different mechanism. Without behavioral context, the number isn't merely directionless: it misleads.

Problem 01

No root cause

A click rate without behavioral analysis doesn't explain the psychological vector exploited, the emotional state triggered, or the organizational failure that allowed it. And without naming that mechanism, two campaigns become incomparable: the variation between them may be the vector, not your defense.

Problem 02

One report for three different audiences

Your CISO needs forensics. The board needs a risk narrative. HR needs human-centered language. A generic PDF serves none of them, and reaches the board as something no one reads.

Problem 03

Phishing exploits trust, not ignorance

Sophisticated attacks work because they exploit trust: a human strength, not a weakness. Training programs that ignore this keep addressing the wrong variable. — Workman, 2007

The report

Three dashboards.
One campaign.

S.E.A.map is a self-contained interactive HTML report. The same campaign data, structured for three distinct audiences, simultaneously, in one file.

Technical

For your security team

Analysts · Blue team · Red team

Forensic-grade analysis. Everything needed to understand, document, and replicate the attack vector.

  • 6-phase attacker map (Nowakowski / IEEE 2025)
  • MITRE ATT&CK + 48 uncharted TTPs via SEA.db
  • Difficulty thermometer: real vs. perceived
  • Social engineering principles with empirical basis
  • Campaign anomalies and critical alerts
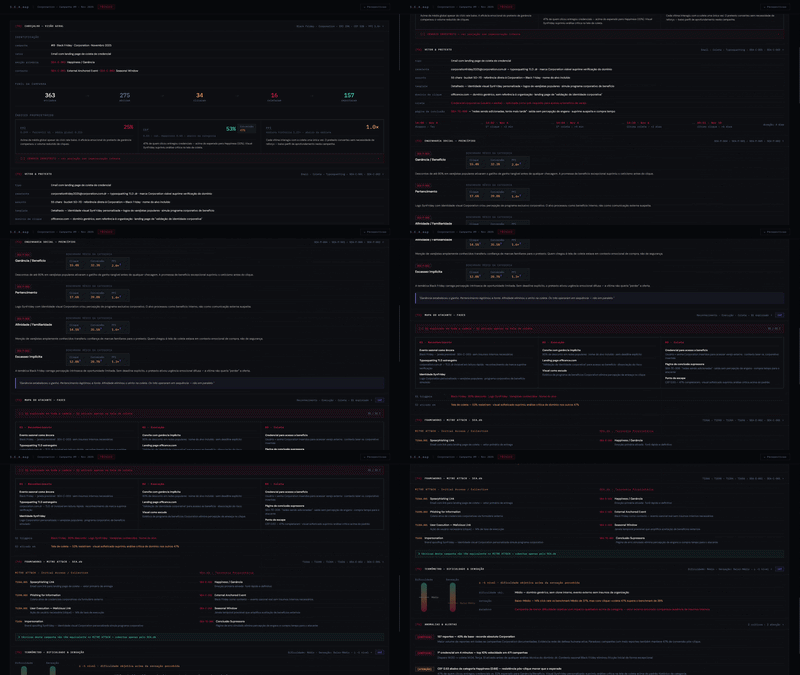
Technical perspective preview
Executive

For leadership and the board

CISO · CRO · Board

A visual risk narrative for strategic decision-making. Business language, no jargon, ready to present.

  • Impact headline with absolute numbers
  • Bow-Tie diagram: cause, event, consequences
  • Impact at 3 levels: employee, leadership, org
  • 3 actions with suggested ownership
  • Historical context: campaign evolution over time
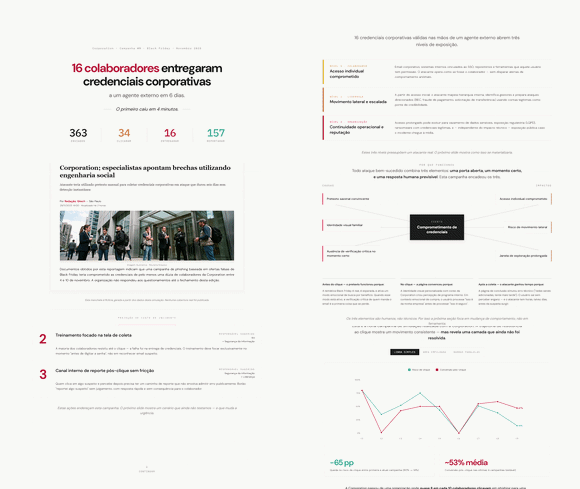
Executive perspective preview
Human / HR

For people and culture

HR · Culture · L&D

Empathetic editorial analysis of human behavior behind the clicks, without blame, without alarm.

  • Victim emotional map with 8-axis radar
  • HFACS: 4 levels of human failure in HR language
  • Victim trajectory through the attack funnel
  • Trust framing, not ignorance framing
  • Reflection questions for HR and leadership
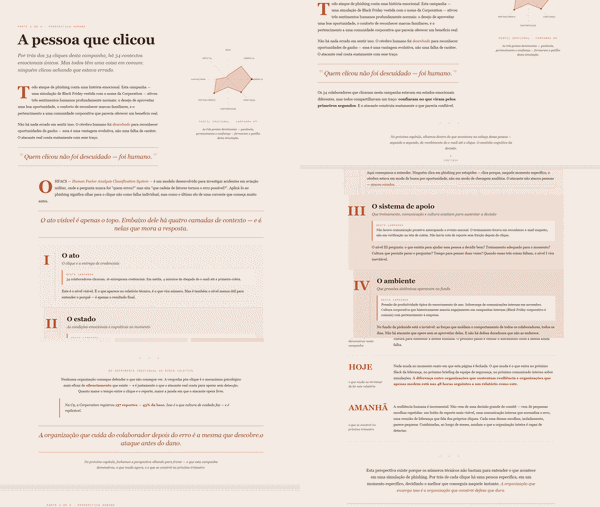
Human perspective preview
The attack map

The anatomy of
the attack.
In one view.

Every element of the report: the emotional vector, the psychological principles, the technical techniques, the organizational failure points. All collapsed into a single visual system. The causal chain from pretext to credential, mapped as topology. Built to be shown in a room, not read in a document.

S.E.A.map — Attack anatomy visualization
S.E.A.map · attack anatomy · context → principles → emotions → techniques → outcome
The risk you're not measuring

Did you improve —
or did you just
change the attack?

The standard report hands you a number and an industry benchmark. But comparing this quarter's campaign to the last only measures progress if both tested the same mechanism. Change the emotion exploited, and the drop in click rate stops being progress, it becomes the physics of the vector. S.E.A.map names the principle and the emotion behind each campaign, and that's what makes the comparison honest.

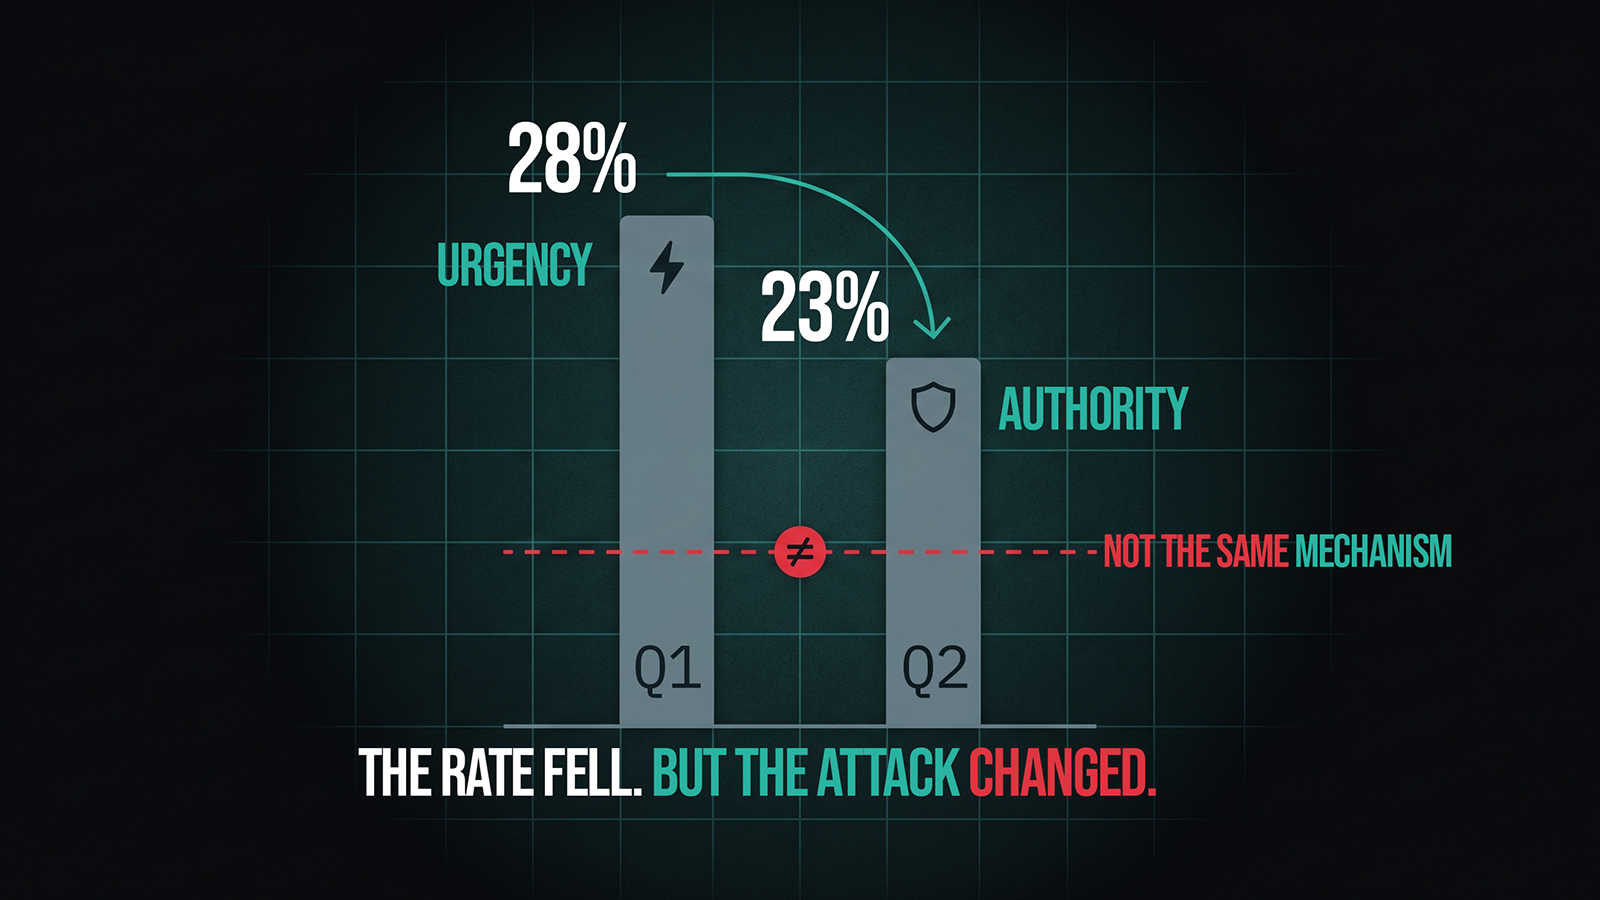
The rate fell, the mechanism changed, the progress is an illusion
The standard report

The rate fell from 28% to 23% from one cycle to the next. It looks like progress. But the mechanism changed, and no one flagged it. You credit your program with a result that may be the vector's alone. Presumed risk.

With S.E.A.map

Every campaign ships with the principle and emotion named. From your second S.E.A.map of the same mechanism onward, comparing two cycles shows real evolution, attributable to training, not to the luck of the vector. Measured risk.

Comparing campaigns with different mechanisms doesn't measure evolution. It measures noise. It's classification by emotion that makes evolution legible, the value isn't in any single campaign, it's in the trajectory.
Proprietary metrics

Beyond
click rate.

Three metrics developed from 800+ custom-built simulations. They measure what the standard benchmark ignores, and each one is grounded in empirical academic literature. And they calibrate by emotion, not by industry: it's the mechanism, not the sector, that says whether a number is good or bad.

ERI
Emotional Risk Index

Measures the emotional risk of the campaign: which emotions were exploited and how intensely they impaired judgment. The higher the ERI, the more sophisticated the emotional attack vector. — Algarni et al., 2013

Calibrated against simulations dataset · percentile comparison per profile
CEF
Cognitive Escape Factor

Measures how much the campaign suppressed critical thinking, the autopilot that leads to a click without reflection. Captures the intention-behavior gap in a single number. — Shropshire et al., 2015

Compared against emotion-category benchmark from dataset
PPI
Phishing Persistance Index

Measures behavioral depth: average submissions per unique victim (minimum 1.0×). A PPI above 1.0× signals targets who returned after first submission: active belief in the pretext, highest vulnerability profile. — SEA.ops

Historical max across dataset:
Get in touch

See what your data actually says.

Reach out to request a live demo with anonymized real campaign data, or to discuss how S.E.A.map fits your simulation program.